Better monitoring for better customer experiences - NewRelic
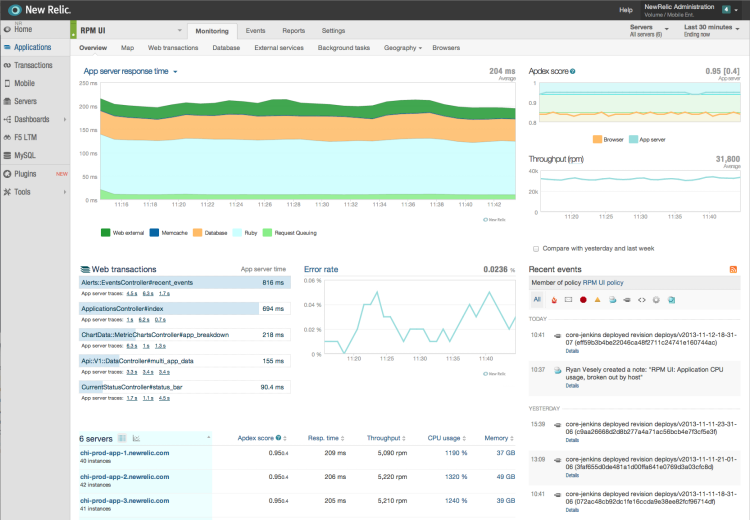
New Relic gives you deep performance analytics for every part of your software environment. You can easily view and analyze massive amounts of data, and gain actionable insights in real-time. For your apps. For your users. For your business.
How it is helping you in app performance measurement & improvement?
Basically to analyze where your code is taking too long (bottlenecks) or breaking or not scaling.
It’s proactive management. Also with the reminder emails, it lets you keep an eye on metrics you sometimes log, but aren’t looking at.
Is New Relic's Insights worth it?
From my point of view it is one of the most important features of a modern APM tool to combine application performance and customer experience.
If you want to stick with New Relic then it probably is worth it.
Application Performance Monitoring Features :
Is it your application or the network that’s slowing you down? New Relic APM gives you grouped views for quick-diagnosis of domain-level problems. Drill down into specific requests to see performance metrics by response time, throughput, and data transfer size.
1. Application Monitoring
Application Monitoring in one place allows you to see your application performance trends at a glance – from page load times, to error rates, slow transactions, and a list of servers running the app.

2. Database Monitoring
Database monitoring provides a detailed overview of your database performance - pointing out critical errors that are slowing down your application. ( ex : Time Spent in Database Calls, Slow SQL Report, SQL Query Analysis, Database Call Response Time and Throughput, Filter to a specific database/cache type )
3. Availability & Error Monitoring
Alerting enables you to set your own warning and critical thresholds so you can stay on top of finding and resolving problems quickly, and collaboration allows you to easily share problems/solutions with your team members. (Alert Policies, Availability Monitoring)
4. Reports
Create and receive customized reports that are just as easy to read as they are to share. Our detailed reports include everything from deployments and availability, to performance and customized dashboards. (ex : Custom dashboards, Availability, Capacity, Host Usage, Deployments, Scalability, SLA )
5. Team Collaboration
APM tools make it easy for DevOps teams to collaborate, share, and work together to solve problems.
Notes/Comments :
Collaborate with your team members in context of a report by adding notes/comments and replying inline.
Integrated Collaboration Tools (JIRA, PagerDuty, HipChat, & more) :
File tickets related to performance problems directly into your ticketing system. Learn which ticketing systems we support here.
6. Security
New Relic is committed to helping customers make their applications fast and secure.( ex : SOC2 Audited, Secure by Default, Enterprise Mode, Secure Data Center, etc..)
Reference : newrelic.com